Who Watches the Watchers? Meet Cops: Zero-Overhead Fleet Monitoring in Pure Coni
Let’s be honest about the state of server monitoring in 2026.
If you read the standard DevOps playbooks, monitoring your personal machines or homelab requires a technological sacrifice:
- Deploy Prometheus (and pray its TSDB doesn’t eat your RAM alive).
- Install Node Exporter as a daemon on every single target machine.
- Configure Grafana (because what is life without 47 nested JSON dashboards and a 500ms dashboard refresh lag?).
- Spin up Alertmanager, configure Webhooks, and set up a reverse proxy with TLS certificates.
Before you know it, you are running 4 GB of RAM and 12 background processes just to monitor a fleet of machines that were mostly idling at 3% CPU anyway. You have spent more compute resources watching your servers than the servers spend doing actual work.
I wanted something different. Something fast, keyboard-driven, beautiful, and completely zero-overhead.
Meet Cops (coni ops): a lightweight, reactive terminal fleet monitor built in pure Coni that turns your Tailscale mesh or SSH targets into a live, interactive operations deck.
No client agents. No remote daemons. No telemetry ingestion pipelines. Just pure SSH, native Tailscale auto-discovery, braille sparklines, and instant reactive TUI rendering.
Let’s take it for a spin with two real machines from the fleet: niko-s5 and pinkpanther.
The View from the Bridge
Here is what it looks like when you fire up cops targeted at niko-s5 and pinkpanther:
coni cops/main.coni niko-s5 pinkpanther
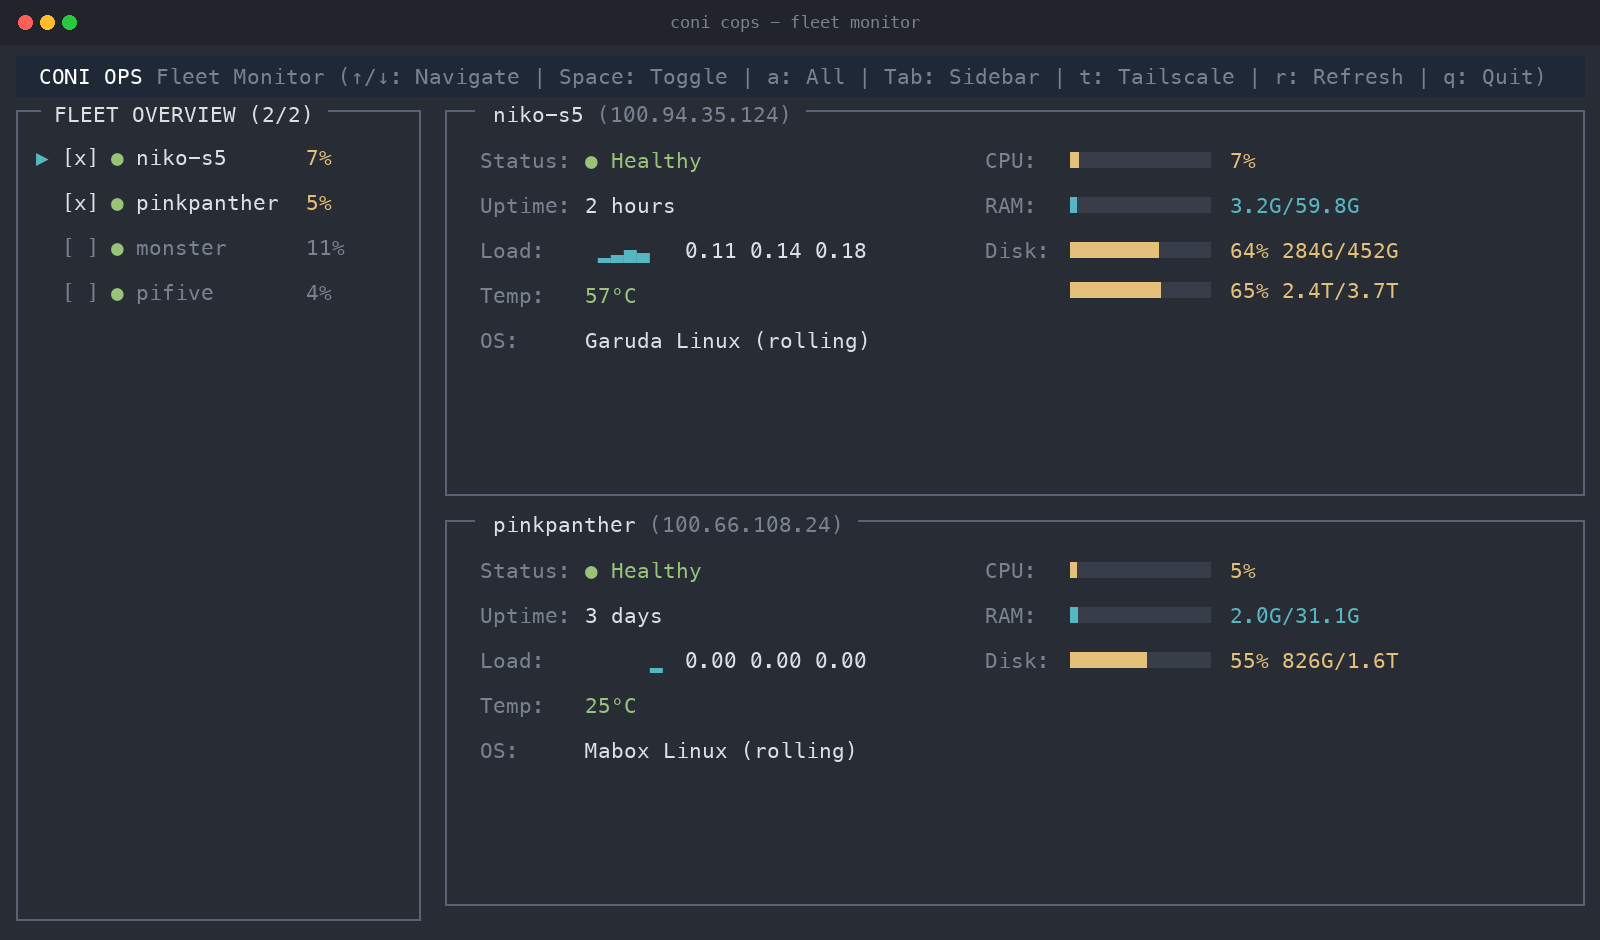
Look at that layout. In a single terminal window, you get:
- FLEET OVERVIEW Sidebar: Live host status dots, instant CPU badges, and vim-friendly (
j/kor↑/↓) keyboard navigation. HitSpaceto toggle servers on/off, orato stack everything on screen simultaneously. - Braille Sparklines: Real-time load averages rendered as ultra-compact unicode braille charts (
▂▃▅▄). - Thermal Badges: Color-coded temperatures that stay cool green when healthy, flip yellow at 60°C, and scream bold red if your CPU starts boiling at 75°C+.
- Multi-Partition Gauges: Automatic mount detection that filters out loopback devices and EFI partitions, neatly stacking your root NVMe alongside your multi-terabyte storage arrays.
- GPU & APU Intelligence: Live detection of discrete GPUs (
AMD Radeon,NVIDIA) and unified APUs (AMD APU), breaking down VRAM usage per physical card rather than pretending your multi-GPU monster is a single giant slab of RAM.
A Tale of Two Machines: Garuda vs. Mabox
To see why cops is so satisfying, look closely at our two targets in the screenshot:
1. niko-s5: The Battle-Hardened Workstation
- OS: Garuda Linux (rolling)
- Specs: 60 GB RAM, fast NVMe root plus a 3.7 TB secondary array
- Personality: The noisy, high-performance daily driver. Running rolling kernels, compiling code, driving multiple displays, and idling at a warm 57°C with a 7% CPU pulse. Notice the multi-disk view automatically rendering both
/dev/nvme0n1p2(64% of 452G) and/run/media/niko/518(65% of 3.7T) without needing manual configuration.
2. pinkpanther: The Serene Stealth Node
- OS: Mabox Linux (rolling)
- Specs: 32 GB RAM, 1.6 TB fast NVMe
- Personality: The ultra-chill companion. Mabox is lightweight, sleek, and quiet. Look at that CPU: sitting at 5%, RAM barely sipping 2.0 GB out of 31 GB, and running at a frigid 25°C with a load average of
0.00 0.00 0.00. It’s so calm it might actually be meditating.
With a quick keystroke, you can flick between them, inspect their disk consumption, monitor memory pressure, or press Tab to collapse the sidebar entirely and give full terminal real estate to your servers.
How It Works: Zero-Agent Architecture
The biggest design principle behind cops is: never install a daemon when the OS already has everything you need.
When cops polls a node, it executes an ultra-compact, POSIX-compliant metric probe through an authenticated SSH multiplex socket. In one round-trip (taking less than 150ms over a local Tailscale wire), it reads:
uptime(for load averages and uptime strings)df -h -P(filtered down to real physical block mounts)free -m(for normalized memory consumption)ps(for aggregated CPU usage)hwmon/thermal_zone(for kernel-level core thermals)rocm-smi/nvidia-smi(for GPU VRAM and card architecture)
;; Fetching node metrics in a non-blocking background fiber
(defn fetch-metrics [host]
  (try
    (let [out (sys-exec (str "ssh -o ConnectTimeout=5 -o BatchMode=yes " host " '...metric-probe...'"))
          lines (str/split out "\n")
          up-raw   (get lines 0 "")
          disk-raw (get lines 1 "N/A")
          ram-raw  (get lines 2 "N/A")
          cpu-raw  (get lines 3 "0")
          gpu-raw  (get lines 4 "N/A")
          temp-raw (get lines 5 "N/A")
          os-raw   (get lines 6 "N/A")]
      ;; Atomically update our persistent reactive state
      (swap! *state update :metrics assoc host
             {:status "Healthy"
              :uptime (parse-uptime up-raw)
              :disk disk-raw
              :cpu cpu-raw
              :mem ram-raw
              :gpu gpu-raw
              :temp temp-raw
              :os os-raw
              :load-history (update-history host up-raw)}))
    (catch e
      (swap! *state update :metrics assoc host {:status "Offline"}))))
Because Coni has native support for CSP concurrency and background fibers (spawn), querying 10 servers across your VPN happens completely in parallel without dropping a single UI frame.
Persistent State with patom
One of the coolest features of the Coni language is patom (Persistent Reactive Atom).
Notice that when you navigate your server list, toggle hosts on and off, or collapse the sidebar, you don’t want those preferences wiped out when you restart the app. In traditional CLI apps, you’d spend fifty lines parsing YAML files or SQLite caches.
In Coni, you simply define your root state as a persistent atom:
(def *state (patom "cops_state.edn" {
  :hosts []
  :selected-hosts {}
  :tailscale-info {}
  :sidebar-open? true
  :metrics {}
} {:compress false :watch true}))
Every time you hit Space to toggle niko-s5, or press t to re-sync your Tailscale mesh, patom automatically synchronizes the state to cops_state.edn. If another terminal window or background process updates cops_state.edn, the :watch true option triggers an instant reactive UI re-render.
The Secret Weapon: Tailscale Auto-Discovery
Don’t want to type hostnames by hand? Just hand it off to Tailscale:
coni cops/main.coni --tailscale
cops automatically queries your local Tailscale daemon (tailscale status --json), filters out mobile phones (sorry, iOS and Android, you don’t get server monitors today), resolves hostnames, and populates your fleet checklist dynamically. Hit a to toggle all online nodes, and your entire private infrastructure is singing on your screen.
Keyboard Shortcuts Reference
| Key | Action |
|---|---|
↑ / ↓ (or j / k) |
Navigate server list in sidebar |
Space / Enter |
Toggle highlighted server on/off |
a |
Select All / Deselect All |
Tab |
Toggle sidebar visibility |
t |
Re-discover Tailscale fleet |
r |
Force refresh all selected metrics |
q |
Quit cleanly |
Conclusion
Monitoring doesn’t have to be a multi-gigabyte enterprise software suite that requires a dedicated operations engineer to keep running.
With a modern functional language like Coni, a few lightweight SSH probes, and a snappy TUI, you can have a monitoring tool that starts in 10 milliseconds, consumes virtually zero CPU, looks stunning on your terminal, and lets you keep an eye on your entire fleet—from beefy workstation rigs like niko-s5 to whisper-quiet nodes like pinkpanther—without ever leaving your terminal flow.
Give your servers a visit. And let cops watch the watchmen.