Tokyo Stock Exchange Jquants API
The just out of beta jquants-api propose sets of daily financial data from over 4000 listed companies on the Tokyo Stock Exchange.

Currently, the sets of data that can be accessed via the API are:
- Listed Issue Information
- Stock Price Information
- Market Information
with more to come in the near future.
While current historical data is only available starting from 2017 users are encouraged to provide feedback to the API via usual github (etc..) channels so as to understand usage in more details.
The API is currently free for personal use, and to access it you only need to spend a few seconds to register and create an account on the official website with an email, a password and some basic details.

To match the API, some people from the community have already proposed wrappers around the http calls, to make data analysis easier.
Some of those wrappers are available on JQuants’s github, notably data scientists focused languages like R, and Python.
This article will focus on accessing the JQuants API from a JavaVM language, and in particular Java and Clojure using the jquant-api-jvm project.
Accessing the JQuants API using Java
Once you have setup your username password via the online form, you need to either:
- create a file at $HOME/.config/jquants/login.edn with the following content:
{:mailaddress "john@doe.com", :password "johndoe"}
Or
- call the login function of the jquantsapi object.
jquantsapi api = new jquantsapi();
api.login("john@doe.com", "johndoe");
Note, that this second way will effectively just do the same as the manual step above, and create a login.edn file with your credentials.
Simple Daily Call to the API
Map<?,?> result = api.daily(code, "20220301");
System.out.println(result);
Result retrieved from the API is a map of maps is a single daily entry along the JQuants API specifications.
{
    "daily_quotes": [
        {
            "Code": "86970",
            "Close": 2178.0,
            "Date": "20220301",
            "AdjustmentHigh": 2204.5,
            "Volume": 1180200.0,
            "TurnoverValue": 2575637550.0,
            "AdjustmentClose": 2178.0,
            "AdjustmentLow": 2172.5,
            "Low": 2172.5,
            "High": 2204.5,
            "Open": 2183.5,
            "AdjustmentOpen": 2183.5,
            "AdjustmentFactor": 1.0,
            "AdjustmentVolume": 1180200.0
        }
    ]
}
As a reminder, You can easily query that object using the proven jxpath.
JXPathContext context = JXPathContext.newContext(result);
Double open = (Double) context.getValue("/daily_quotes[1]/Open");
System.out.printf("Quote for %s on day %s is %f\n", code, date, open);

// OUTPUT
// Quote for 24130 on day 20220301 is 4315.000000
When calling jquants, you can also specify a range of dates to retrieves Quotes from:
Map<?,?> result = api.daily(code, from, to);
JXPathContext context = JXPathContext.newContext(result);
System.out.println(context.selectNodes("//Open"));

// OUTPUT
// [4315.0, 4455.0, 4595.0, 4479.0]
Retrieving listed info or financial statements can also be done smoothly as shown in the example below:
Map<?,?> listedInfo = api.listedInfo(code);
JXPathContext context = JXPathContext.newContext(listedInfo);
System.out.printf("Code %s is for companyName %s\n", code, context.getValue("//CompanyNameFull"));

// OUTPUT
// Code 24130 is for companyName エムスリー

Map<?,?> statements = api.statements(code, "20220727");
JXPathContext context2 = JXPathContext.newContext(statements);
System.out.printf("Profit: %s for Code %s\n", context2.getValue("//Profit"), code);

// OUTPUT
// Profit: 12127000000 for Code 24130
Instead of using the code to access daily data, the Java wrapper also propose a dailyFuzzy method where you can directly use the EnglishName of the company instead of its code.
To achieve that it creates a local cache, so the first call would be a bit slow but then you would be able to do something like querying the quotes using the Company Name, like:
Map m = Map.of("CompanyNameEnglish","Japan Exchange","from", "20220301","to", "20220401");
Map result = api.dailyFuzzy(m);
System.out.println(result);
That piece of code returns just the same kind of result as the standard daily function.
{
    "daily_quotes"[
        {
            "Volume"1180200.0,
            "AdjustmentOpen"2183.5,
            "Open"2183.5,
            "Close"2178.0,
            "AdjustmentClose"2178.0,
            "Date""20220301",
            "AdjustmentVolume"1180200.0,
            "High"2204.5,
            "AdjustmentHigh"2204.5,
            "Low"2172.5,
            "Code""86970",
            "AdjustmentFactor"1.0,
            "TurnoverValue"2.57563755E9,
            "AdjustmentLow"2172.5
        }
...
		{
            "Volume"1150000.0,
            "AdjustmentOpen"2273.5,
            "Open"2273.5,
            "Close"2323.5,
            "AdjustmentClose"2323.5,
            "Date""20220401",
            "AdjustmentVolume"1150000.0,
            "High"2330.5,
            "AdjustmentHigh"2330.5,
            "Low"2253.5,
            "Code""86970",
            "AdjustmentFactor"1.0,
            "TurnoverValue"2.659037E9,
            "AdjustmentLow"2253.5
        }
    ]
}

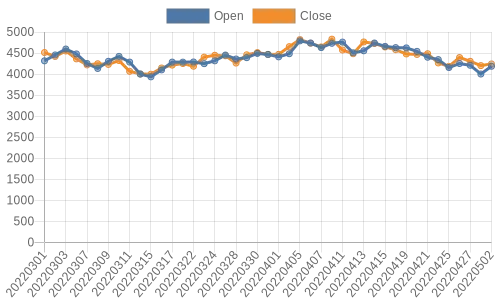
In the JavaSample sub project on github you can also find a quick example on how to chart the returned quotes, using [quickchart.io](https://quickchart.io

```java
Map<?,?> result = api.daily(code, "20220301", "20220505");
JXPathContext context = JXPathContext.newContext(result);

QuickChart chart = new QuickChart();
chart.setWidth(500);
chart.setHeight(300);
String config =
        format("{type: 'line',data: {labels: %s , datasets: [{label: 'Open', data:%s ,fill: false}, {label: 'Close', data:%s ,fill: false}]}}",
                context.selectNodes("//Date"),
                context.selectNodes("//Open"),
                context.selectNodes("//Close"));
chart.setConfig(config);

System.out.println(chart.getUrl());
The quickchart.io API is free for basic usage, and quite convenient for sharing generated graph. The configuration for the graph itself is a standard JSON config.
Running the code above outputs a chart URL that you can use to access and re-access the generated chart.

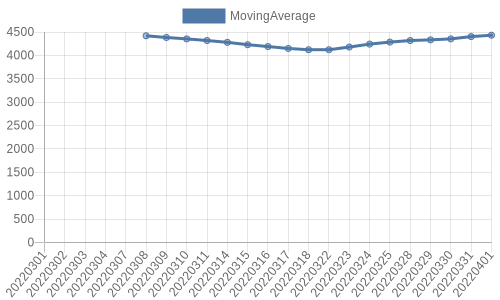
Other code samples are in the code, among others how to generate a graph of a 3-day moving average of daily opens quotes…

The full java code for this is on github.
Accessing the JQuants API using Clojure
The wrapper itself is internally coded in Clojure, so accessing the JQuants API in Clojure is convenient in the way that you can get maps filled in with the edn format usual keywords instead of strings.
The wrapper functions are consistent with the Java functions. To retrieve daily quotes, you would use:
(require '[hellonico.jquants-api :as api])

(def raw (api/daily {:code 2413 :from 20220301 :to 20220328}))
(def data (raw :daily_quotes))
One extra advantage of using Clojure on the JVM is that you need an external library to query the data.
(-> data first :Open)
; 4315.0
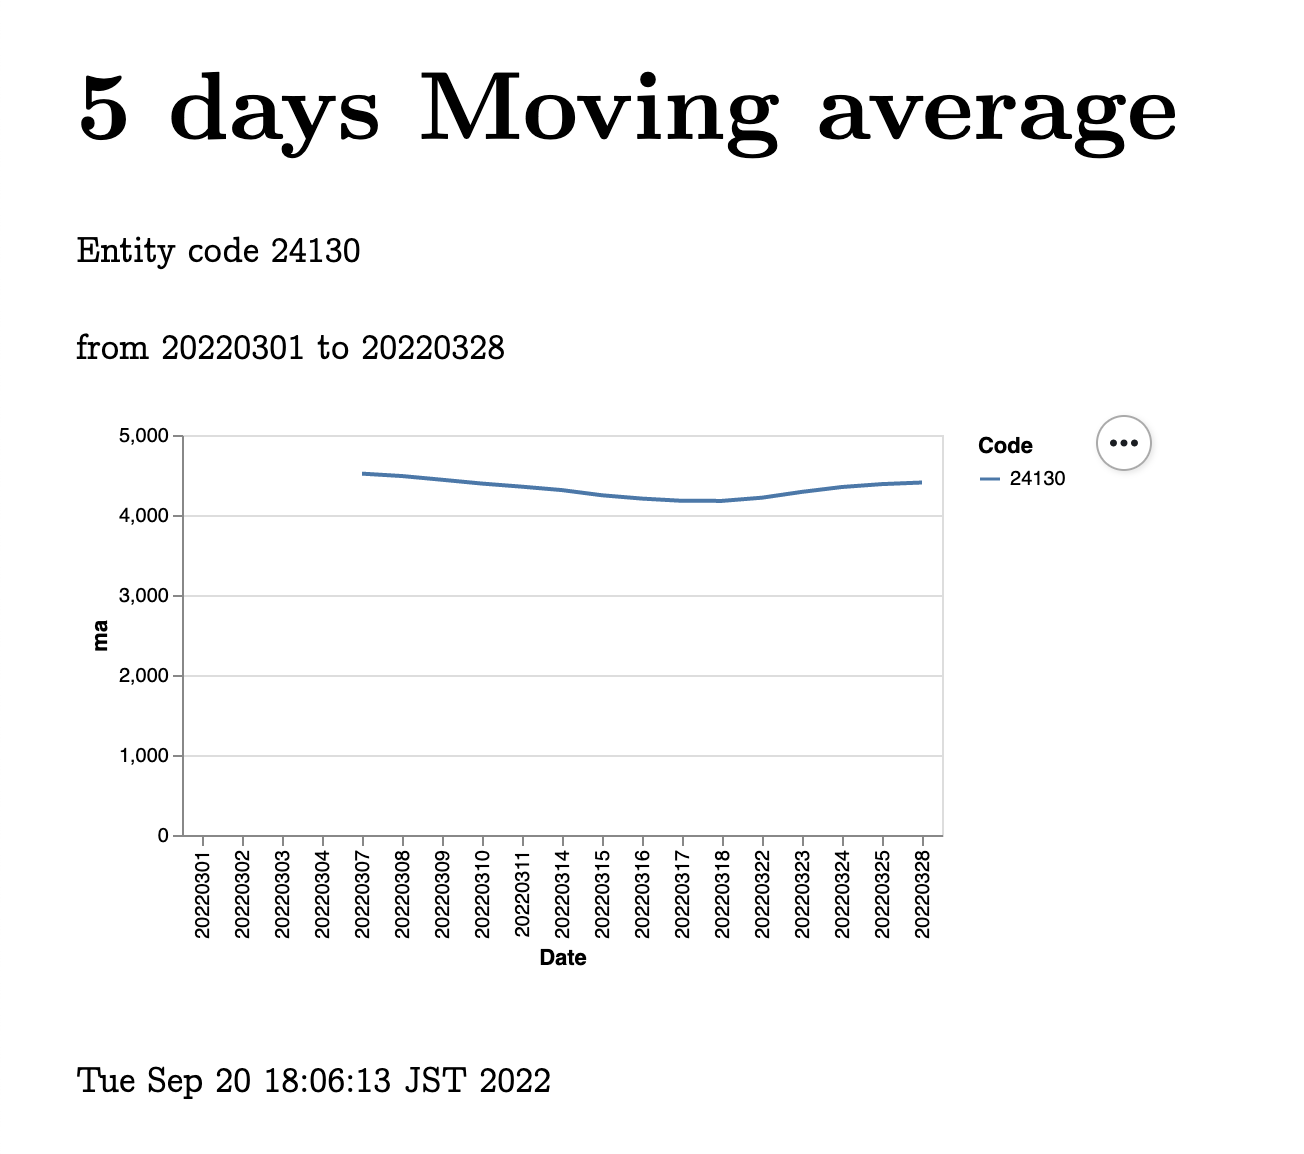
Here again the wrapper propose an easy to follow example on how to chart a moving average of daily quotes using the JQuants wrapper along the oz charting library.
From the daily quotes retrieved from the JQuants API, a 5-days moving average is first computed:
(defn average [coll]
  (/ (reduce + coll)
     (count coll)))

(defn ma [period coll]
  (lazy-cat (repeat (dec period) nil)
            (map average (partition period 1  coll))))
(def ma-5 (partial ma 5))

(def _data
   (map #(assoc %1 :ma %2) data (ma-5 (map :High data))))
The data is thus updated with a :ma entry for each quote, and this is used in a chart configuration:
(def data-plot
  {:data {:values _data}
   :encoding {:x {:field "Date" :type "ordinal"}
              :y {:field "ma" :type "quantitative"}
              :color {:field "Code" :type "nominal"}}
   :mark "line"})
That can be graphed using hiccup-like syntax.
(def viz
  [:div
   [:h1 "5 days Moving average"]
   [:p "Entity code 24130"]
   [:p "from 20220301 to 20220328"]
   [:vega-lite data-plot]
   ;[:h2 "If ever, oh ever a viz there was, the vizard of oz is one because, because, because..."]
   [:p (str (java.util.Date.))]
   ])
Which outputs the following chart:

To make this even more useful and fun, it would be nice to get outside contributions like a ready to use Jupyter Notebook example via IJava.
The jquants-api-jvm is available under the opensource-friendly Eclipse license and as a reminder new ideas for the jquants API datasets are welcome to be talked about and shared with the community.