Building a Real-time Terminal Weather Dashboard in Coni
Who says the terminal has to be boring?
Recently, I stumbled across some stunning e-paper displays online. You know the ones—sleek, grid-based layouts showing live stock market numbers and crypto rates. It got me thinking: what if we could replicate that exact aesthetic natively in the terminal using Coni?
As it turns out, it’s not just possible—it’s incredibly easy.
Thanks to Coni’s built-in ui-mount primitive, we don’t have to mess around with raw ANSI escape codes or manual cursor positioning. We just declare our UI state, map it to a layout tree, and let the engine do the heavy lifting!
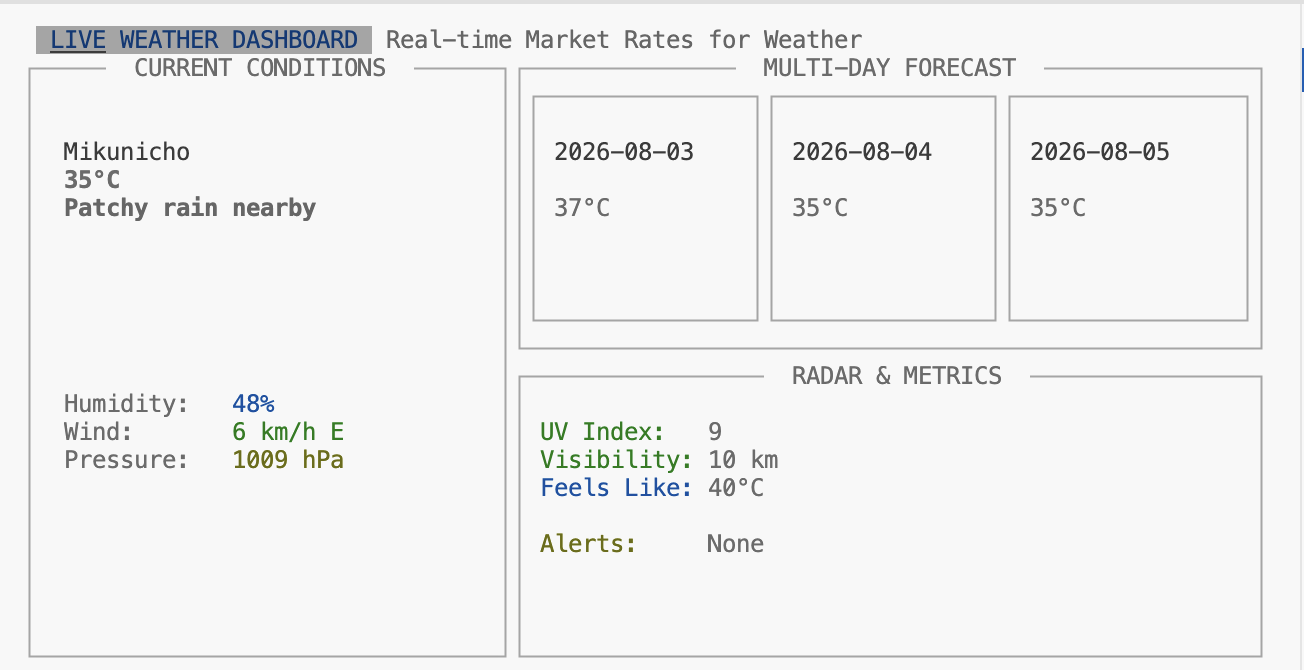
Here’s the result:
Fetching the Data
To make it actually useful, we pull live data from wttr.in. Coni’s native sys-http-get makes HTTP calls trivial, and sys-json-parse automatically converts JSON keys into idiomatic Clojure-style keywords (e.g., :temp_C, :humidity).
We can spawn this inside a background spawn block, firing a loop that quietly sleeps and updates our global state atom every 10 minutes.
(require "libs/http/src/http.coni" :as http)
(require "libs/json/src/json.coni" :as json)

(def *state (atom {
  :city "Locating..." :temp "--"
  :condition "Fetching..." :humidity "--"
  :wind "--" :pressure "--" :uv-index "--"
  :visibility "--" :feels-like "--" :forecast []
}))

(defn update-weather []
  (try
    (let [resp (sys-http-get "https://wttr.in/?format=j1")
          data (sys-json-parse resp)
          curr (first (:current_condition data))
          area (first (:nearest_area data))
          city (:value (first (:areaName area)))
          weather (:weather data)
          forecast (map (fn [w]
                          {:day (:date w)
                           :temp (:maxtempC w)})
                        weather)]
      (swap! *state merge {
        :city city
        :temp (:temp_C curr)
        :condition (:value (first (:weatherDesc curr)))
        :humidity (str (:humidity curr) "%")
        :wind (str (:windspeedKmph curr) " km/h "
                   (:winddir16Point curr))
        :pressure (str (:pressure curr) " hPa")
        :uv-index (:uvIndex curr)
        :visibility (str (:visibility curr) " km")
        :feels-like (:FeelsLikeC curr)
        :forecast forecast
      }))
    (catch e
      (swap! *state assoc :condition "Network Error!"))))

;; Auto-Refresh every 10 mins in background
(spawn (fn []
  (loop []
    (update-weather)
    (sleep 600000)
    (recur))))
Declarative Grid Layout
The layout is built entirely with declarative maps. We use :row and :column panes, and define :weight values so the grid perfectly resizes when you stretch your terminal.
(defn render-forecast [state]
  (if (> (count (:forecast state)) 0)
    (map (fn [f]
           {:type :text
            :text (str "\n [cyan]" (:day f) "[-]\n\n"
                       " [white]" (:temp f) "°C[-]")
            :align :center
            :border true})
         (:forecast state))
    [{:type :text
      :text "\n [gray]Loading...[-]"
      :align :center
      :border true}]))

(defn render [state]
  {:type :pane
   :direction :column
   :children [
     ;; Header
     {:type :text
      :text " [blue:white] LIVE WEATHER DASHBOARD [-:-]"
      :size 1}

     ;; Main Split
     {:type :pane
      :direction :row
      :children [

        ;; Left Column (40% width)
        {:type :pane
         :direction :column
         :weight 40
         :border true
         :title " CURRENT "
         :children [
           {:type :text
            :text (str "\n\n  [cyan]" (:city state) "[-]\n"
                       "  [white::b]" (:temp state) "°C[-]\n"
                       "  [gray]" (:condition state) "[-]")
            :size 10}
           {:type :text
            :text (str "\n  Humidity:   [blue]" (:humidity state) "[-]\n"
                       "  Wind:       [green]" (:wind state) "[-]\n"
                       "  Pressure:   [yellow]" (:pressure state) "[-]")}
         ]}

        ;; Right Column (60% width)
        {:type :pane
         :direction :column
         :weight 60
         :children [

           ;; Top Right - Forecast
           {:type :pane
            :direction :row
            :border true
            :title " MULTI-DAY FORECAST "
            :weight 50
            :children (render-forecast state)}

           ;; Bottom Right - Metrics
           {:type :text
            :border true
            :title " METRICS "
            :weight 50
            :text (str "\n [green]UV Index:[-]   " (:uv-index state) "\n"
                       " [green]Visibility:[-] " (:visibility state) "\n"
                       " [blue]Feels Like:[-] " (:feels-like state) "°C\n\n"
                       " [yellow]Alerts:[-]     None\n")
           }
         ]}
      ]}
   ]})

;; Mount to Terminal!
(ui-mount *state render)
Why this is awesome
The real magic here is the ui-mount primitive. Notice how there are zero imperative UI updates? We don’t manually clear the screen or print new lines. Because we mount the *state atom to the render layout tree, any time the background spawn loop calls swap! to mutate the global state, the terminal natively re-calculates the diff and instantly repaints just the updated text boxes.
Give it a try and transform your terminal into a sleek weather station!
What’s Next? (Raspberry Pi & IoT Ideas)
Because Coni’s ui-mount engine is so declarative and automatically handles resizing, it’s absolutely perfect for Raspberry Pi e-ink displays, tiny LCDs, or old iPads repurposed as SSH terminals.
Here are a few other fun, highly practical CLI dashboards you could build in just a few lines of code:
- 📈 Crypto & Stock Market Ticker: Map out a grid of tiles for Bitcoin, Ethereum, and your favorite tech stocks. Using Coni’s built-in
(spawn)loop, it can glow green or red as the prices change in real-time. - 🧠 Smart Home & IoT Hub: Hit local Home Assistant or Philips Hue APIs. You could have a 2x2 grid showing Living Room Lights, Front Door Lock status, and what’s currently playing on Spotify.
- 🖥️ Homelab Server Monitor: A sleek resource monitor for a home server rack. You can use Coni’s
(sys-exec "top -l 1")to pull system data and use theui-mountengine to draw progress bars for CPU load and RAM usage. - 📝 Daily Kanban & Focus Timer: Build a “Deep Work” screen that pulls your tasks for today on the left column (using Coni’s
todoistlibrary), and has a giant 25-minute Pomodoro countdown timer running in the right column. - 📰 AI-Summarized Morning Briefing: Combine
sys-http-get(to fetch RSS feeds) with Coni’s native LLM integrations. The background thread could fetch the top 5 articles, pass them to a local LLM to write a 1-sentence summary for each, and display them in a clean, scrollable terminal feed on your desk.
The terminal is your oyster. Happy hacking!
The Grand Vision: Coni Ops (SSH Fleet Manager)
I’d actually position it less as an SSH client and more as a terminal control center for infrastructure.
A terminal-native dashboard for managing fleets of Linux servers from a single interface. Rather than opening dozens of SSH sessions, the Fleet Manager provides a live overview of every machine and lets you inspect, troubleshoot, and operate them from one place.
Dashboard
Fleet Overview

  Production      24 servers
  Staging          8 servers
  Development     15 servers
  Home Lab         6 servers

──────────────────────────────────────────────

✓ api-01              12% CPU   48% RAM
✓ api-02              18% CPU   52% RAM
⚠ worker-03           95% CPU   91% RAM
✗ redis-01            Offline
✓ postgres-01         Healthy
The dashboard refreshes continuously and immediately highlights unhealthy machines.
Server Details
Selecting a server opens a detailed view.
Hostname      api-01
OS            Ubuntu 24.04
Kernel        6.12
Uptime        36 days
Load          0.42

CPU           ████░░░░░░ 38%
Memory        ██████░░░░ 61%
Disk          ██░░░░░░░░ 24%
Network       320 Mbps
Additional panels include:
- Running services
- Docker containers
- Disk usage
- Mounted filesystems
- Active users
- Recent logs
- Open ports
- Installed software
Interactive Operations
Every server can be managed directly. Examples:
- Restart a service
- Tail live logs
- Open an interactive shell
- Browse files
- Upload or download files
- Reboot
- Shutdown
- Update packages
- Check system health
Multi-Server Operations
One of the strongest features is executing commands across an entire fleet.
Run command
> sudo systemctl restart nginx

Targets
✓ Production
✓ Staging

Running...
24 / 24 completed
Results are aggregated, making it easy to identify failures without opening individual SSH sessions.
Docker & Kubernetes
When available, the manager automatically detects container environments.
- Docker: Running containers, Images, Volumes, Logs, Restart containers
- Kubernetes: Namespaces, Pods, Deployments, Events, Live logs, Resource usage
Monitoring & Alerts
Built-in live monitoring includes CPU history, Memory trends, Disk utilization, Network throughput, Temperature (where available), Process list, and Top resource consumers.
Servers exceeding configurable thresholds are highlighted immediately (e.g., High CPU, Low disk space, Offline host, Service failure, Expiring certificates).
Architecture
The Fleet Manager is intentionally lightweight.
Fleet Manager
        │
        ├── SSH
        ├── SCP
        ├── SFTP
        └── Optional Agent
             ↓
Linux Servers (AWS EC2, Azure VMs, Google Cloud, Raspberry Pi, Home Lab)
No mandatory agents are required. Standard SSH is sufficient for most functionality, with an optional lightweight agent for enhanced metrics.
Why it’s a great Coni showcase
This application demonstrates many aspects of the language and runtime:
- Terminal UI layouts
- Live asynchronous updates
- Networking
- SSH integration
- Concurrent execution across many hosts
- Streaming logs
- Interactive widgets
- Charts and sparklines
- Keyboard-driven workflows
- Cross-platform native binaries
It is also a practical tool that developers, DevOps engineers, SREs, and system administrators could use every day, making it both a compelling demo and a valuable real-world application.
I also see a natural evolution where this becomes Coni Ops: not just SSH, but a unified interface for SSH, Docker, Kubernetes, MCP servers, Git repositories, CI/CD pipelines, and local AI assistants—all within a single terminal workspace. That would differentiate it from traditional SSH managers by making it an operational cockpit rather than just a connection manager.