Clojure for DataScience a la numpy
Modrzyk, N. (2019). Clojure. In: Sakr, S., Zomaya, A.Y. (eds) Encyclopedia of Big Data Technologies. Springer, Cham. https://doi.org/10.1007/978-3-319-77525-8_302
In the Clojure world the Python’s numpy equivalent is named tablecloth, which acts as a data frame grammar wrapping tech.ml.dataset. It has much, if not all, the functions you would expect for data science associated with an impressive speed for handling data, provided you stick with the library functions. In this short section we will see how to work with tablecloth data frames, to handle data from the just out JQuants API from the land of the rising sun where sushi shines and the sky is blue.
A simple goal for this section would be to retrieve all the quotes for M3, and compute the mean average of its stock value per year, and do a sort on those average.
To have the necessary your project’s deps.edn should look like the below:
:deps {org.clojure/clojure {:mvn/version "1.11.1"}
             scicloj/tablecloth {:mvn/version "6.094.1"}
             net.java.dev.jna/jna {:mvn/version "5.12.1"}
             net.clojars.hellonico/jquants-api-jvm {:mvn/version "0.2.9"}}
And importing the two following namepsaces in your current session:
(require '[hellonico.jquants-api :as api])
(require '[tablecloth.api :as tc])
We get starting retrieve in stock quotes for M3 using the daily-fuzzy code, which helps you not having to remember the company code.
(def quotes
     (:daily_quotes (api/daily-fuzzy {:CompanyNameEnglish "M3"})))
You can check how many quotes you got by creating a data set out of it, and counting rows:
(-> quotes
    (tc/dataset)
    (tc/row-count))
; 1402
We can also start printing the first 5 rows of the set:
(-> quotes
     (tc/dataset)
     (tc/head 5))
Which prints too many columns for this article, so let’s clean up our set by :
- formatting the column names with keywords instead of strings
- Replacing the content of the :Date column by parsing it as a date properly
- selecting only the :High and :Open and :Date columns from the set.
(-> quotes
    (tc/dataset {:key-fn keyword :parser-fn {:Date [:local-date "yyyyMMdd"]}})
    (tc/select-columns [:Open :High :Date])
    (tc/head 5))
To see how the aggregation works, let’s start by grouping all those values per year and Code from the original dataset.
(-> quotes
    (tc/dataset {:key-fn keyword :parser-fn {:Date [:local-date "yyyyMMdd"]}})
    (tc/group-by (fn [row]
               {:code (:Code row)
                :year (tech.v3.datatype.datetime/long-temporal-field :years (:Date row))})))
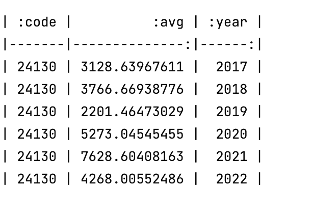
The library generated a new dataset with :name and :data for columns where :name is the group-by that was just defined. Strong of this, we can move to aggregate on the mean average for the Open quotes using:
(-> quotes
    (tc/dataset {:key-fn keyword :parser-fn {:Date [:local-date "yyyyMMdd"]}})
    (tc/group-by (fn [row]
                   {:code (:Code row)
                    :year (tech.v3.datatype.datetime/long-temporal-field :years (:Date row))}))
    (tc/aggregate {:avg #(tech.v3.datatype.functional/mean (% :Open))}))
Which gives you:

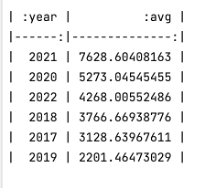
We are close now: we just need to sort this dataset, using the provided order-by function.
(-> quotes
    (tc/dataset {:key-fn keyword :parser-fn {:Date [:local-date "yyyyMMdd"]}})
    (tc/group-by (fn [row]
                   {:code (:Code row)
                    :year (tech.v3.datatype.datetime/long-temporal-field :years (:Date row))}))
    (tc/aggregate {:avg #(tech.v3.datatype.functional/mean (% :Open))})
    (tc/select-columns [:year :avg])
    (tc/order-by [:avg] :desc))
And 2021, seems to have been a good year for M3 and probably its online platform for doctors.
Let’s drop that :code which is not very useful anymore, and finish the example by writing the data to a csv file.
(-> quotes
    (tc/dataset {:key-fn keyword :parser-fn {:Date [:local-date "yyyyMMdd"]}})
    (tc/group-by (fn [row]
                   {:code (:Code row)
                    :year (tech.v3.datatype.datetime/long-temporal-field :years (:Date row))}))
    (tc/aggregate {:avg #(tech.v3.datatype.functional/mean (% :Open))})
    (tc/select-columns [:year :avg])
    (tc/order-by [:avg] :desc)
    (tc/write-csv! "hello.csv"))
Which outputs:

Which is the content of the generated hello.csv file that has just been generated. If you want you can use filename.csv.gz to compress the resulting file, and there is also direct support for Clojure’s compression nippy format.